
Oracle is well known as a complex environment, and with good reason. Though they will object to that complexity at the sales level, they embrace it at the technical level. Let’s forget for a moment the pains this may have caused us in our careers and focus on an undeniable plus: Oracle gives great metrics.
Of all the environments and architectures I have worked with over the years, Oracle undoubtably has the best reporting. Statspack, AWR, ASH, X$ and V$ views, log files, the list goes on and on. Thanks to these repositories of metadata there really aren’t many problems you can’t diagnose by following the bottleneck trail to the root cause. But with this wealth of insight comes a lot of uncertainty and bad advice which ultimately can lead to a serious case of Too Much Information (TMI).
And because of that, we have…
Five Frequently Misused Metrics
There are of course many metrics that are mishandled, abused, or overlooked in the Oracle world. These are the five that are most apparent in the DBA and developer community.
5. db file scattered read
By talking to many DBAs, it has become apparent to me that there was in fact a third tablet given to Moses at Mt. Sinai which simply said “Thou shalt not full table scan”. For whatever reason it never made it into official biblical canon but DBAs and to some extent developers still honor the lesson to this day. Or something like that.

The misuse of this metric comes from the fear instilled in any new DBA regarding full table scans. At some point DBAs and developers alike were told to treat them like the plague, and an inexperienced DBA will often hunt for them at the first sign of slowness regardless of what’s actually holding up a system.
As you hopefully now know, full table scans aren’t always the devil. There are many times when a full scan is the right way to access table or index data and times when an index is the way to go. The mere sight of the ‘db file scattered read’ metric is not reason enough to panic.
4. Parse to Execute Ratio
Somewhere in the DBA initiation ritual “parse to execute ratio” became synonymous with “hard parsing too much”. Oracle training, documentation, and many tuning blogs and sources don’t do much to expand or dispute this.
Reducing hard parses is something you have to do, but simply reducing hard parses isn’t enough. If you do a hard parse and then execute you have a parse to execute ratio of 1:1. If you do a soft parse then execute you’re still at 1:1. A combination of hard parse reduction and cursor caching is required for a good parse to execute ratio.
Pay close attention to the client software being used against your database. Different application servers and programs will have different cursor caching mechanisms. In this example, JBoss required the ‘prepared-statement-cache-size’ parameter to be set to reuse cursors.
3. Buffer Hit Ratio

When you run an AWR report and look at the Buffer Hit Ratio metric, remember that you’re looking at a one hour average. Over the course of the hour your hit ratio may be 99%, but that doesn’t mean the blocks you needed were in cache when you needed them.
If you are concerned only with having a good buffer hit ratio, make your buffer cache really small and cache a few thousand random blocks then query them again a few times. Instant success!
Buffer hit ratio is a feel good metric and good for dashboards and a quick glance for an outlier time window. Using it purely as a tuning or alert metric is not recommended.
2. CPU %
This is another ‘top’ DBA favorite, but is also very popular among developers, QA/testers, and management. When CPU on a Linux or UNIX system reaches 95%+ CPU usage, alarm bells instantly go up and bad performance is assumed.
I blame Windows. Single CPU machines running bulky operating systems taught us that if CPU is at 99% you’re having a bad day. However, on an Oracle database environment 99% CPU usage can actually be considered a very good thing under the right circumstances.
Usage alone is not a viable metric. One other important metric is the run queue length, or load. This is the stat you see with the uptime or top command (in 1, 5, and 15 minute averages) or realtime using vmstat. It (usually) represents the number of processes waiting/running on CPU at any given moment. As such it is a good measure of concurrency and overall usage of CPU resources in most cases; however, there are exceptions depending on your OS and I/O usage (e.g. uninterruptible I/O wait). A very general rule of thumb is that load should not go above the number of cores on your system, though there are exceptions to this rule as well. To be precise, a combination of CPU usage, load, and I/O wait should be used to evaluate capacity. While gauging your usage, remember that load != percent in use, and multi-core != multi-threaded (no matter what AWR says).
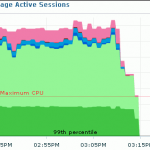
If you really want to tie in wait + work in an Oracle environment, I advocate paying attention to Average Active Sessions. It is an easy to compute and easy to read metric within Oracle that can easily be broken down into individual waiting components and give a good indication of overall load on the Oracle environment.
More on DB Time and Average Active Sessions
1. Cost
Taking the #1 spot for the title of Most Misused Metric Made Meaningful Maladroitly (M6) is cost.
 Just because Oracle’s optimizer is cost based doesn’t mean your tuning practices should be. Cost is a metric Oracle calculates in order to rank execution paths for queries. This means that looking at cost values in explain plans can help you understand why Oracle chose the plan it did.
However, a quick look online or working with some developers and DBAs on query tuning will frequently raise questions like “How do I reduce the cost of this query?” or “Why is my query slow when cost is low?”. The simple truth is that cost is not a tuning metric. When you try to tune a query you should do so with the metrics that matter the most to your situation. In most cases this comes down to reducing block touches (both physical and logical reads) and processing requirements by improving the selectivity, join order, and index usage of your query. If you want to reduce the cost of a specific execution plan so it will be chosen by the optimizer that is a worthwhile goal but trying to reduce the cost of a query in general makes no sense.
Know the bottlenecks that hold up your Oracle instance and your query. Find the components of your query that take a long time or the combination of components that hold up efficient processing. Learn to properly display and read explain plans. And most importantly, don’t stop at just the explain plan. Learn to use tools like tkprof and Tanel Poder’s Snapper utility so you can get the big picture as many query issues arise from issues larger than a ‘bad explain plan’.
Cost is very important to Oracle but plays a bit part in your tuning saga. If you tune strictly to reduce the cost of a query, you are missing out on the big picture and only making tuning harder on yourself.
Good post.
I love the 95% utilization thing. SMT would change that silver bullet number a bit. 🙂
Nice list of things to look out for. When I started working with Sun boxes I was surprised how well they ran at high CPU utilization. Less surprised once I started paying attention to the run queue and other measures as you mention.
In my past life working with non-SQL databases on UNIX, I’d often plot logical reads against (CPU busy * core count) to get a measure of database work per ‘fully utilized core’. Is that a reasonable high level characterization of an Oracle database server – for example a data warehouse that has a fairly predictable ETL and batch report workload?