
If you’re a DBA on Enterprise Edition with the Diagnostics Pack and you don’t use the Automatic Workload Repository (AWR) reports, you are seriously missing out. AWR is the holy grail of snapshot-based metrics at the instance level. There are a ton of resources out there covering AWR, so I won’t be getting into much detail about standard run-of-the-mill AWR reports. Suffice it to say that:
- AWR reports are an outstanding starting point for delving into bottlenecks during a single snapshot window
- They provide metrics for all major components of the Oracle instance
- Database level metrics are also included for I/O times
- Query details and statistics are also included for the snapshot window being viewed
Sometimes it is enough just to look at the DB Time and Top 5 Timed Events (remember, DB Time / Elapsed Time = Average Active Sessions, a great indicator of load for the snapshot window). Other times, you have to delve a little deeper to get a good view of what the instance/database were up to for the duration of the snapshot. And sometimes, that’s not enough; what about when you need to compare it to another time period?
I can’t tell you how many times I’ve walked into a customer’s meeting room to find stacks of AWR reports side by side, ready for comparison. While that is definitely helpful (and sometimes necessary for a long running issue that is difficult to trend), it is often forgotten that Oracle has a built in tool right in the rdbms/admin directory which can compare snapshot windows for you: the AWR Diff Report (awrddrpt). Like AWR, it can be run via PL/SQL or from the OS command line. I used the latter case with:
SQL> @?/rdbms/admin/awrddrpt
Like AWR, you have to choose a snapshot window, except you do it twice. You pick a first begin/end snapshot pair, then a second begin/end snapshot pair. For instance, you could compare last Tuesday from 7-9AM against this Tuesday from 7-9AM.
Specify the First Pair of Begin and End Snapshot Ids

~~~~~~~~~~~~~~~~~~~~~~~~~~~~~~~~~~~~~~~~~~~~~~~~~~~~

Enter value for begin_snap: 13747

First Begin Snapshot Id specified: 13747
Enter value for end_snap: 13749
First End Snapshot Id specified: 13749
Specify the Second Pair of Begin and End Snapshot Ids
~~~~~~~~~~~~~~~~~~~~~~~~~~~~~~~~~~~~~~~~~~~~~~~~~~~~~
Enter value for begin_snap2: 13915
Second Begin Snapshot Id specified: 13915
Enter value for end_snap2: 13917
Second End Snapshot Id specified: 13917
Once you have generated the report (you can choose between text and html like a standard AWR report). The final result is formatted like an AWR report (though much wider), with the same major sections. However, each section will report on the 1st time window, the 2nd time window, the metric delta, and the % difference. You can truly say that your I/O was x% higher or lower this week than last week, or that a wait event had double the impact. For instance, here is an image comparing the top 5 timed events:
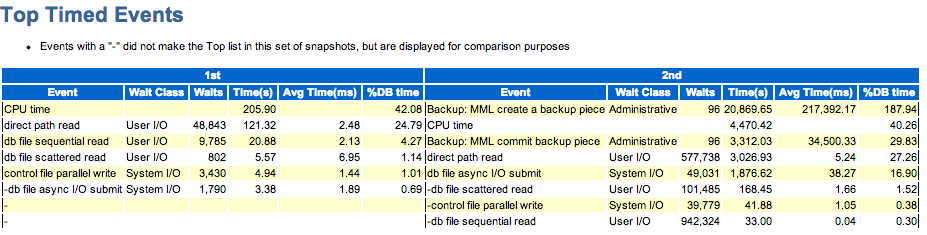
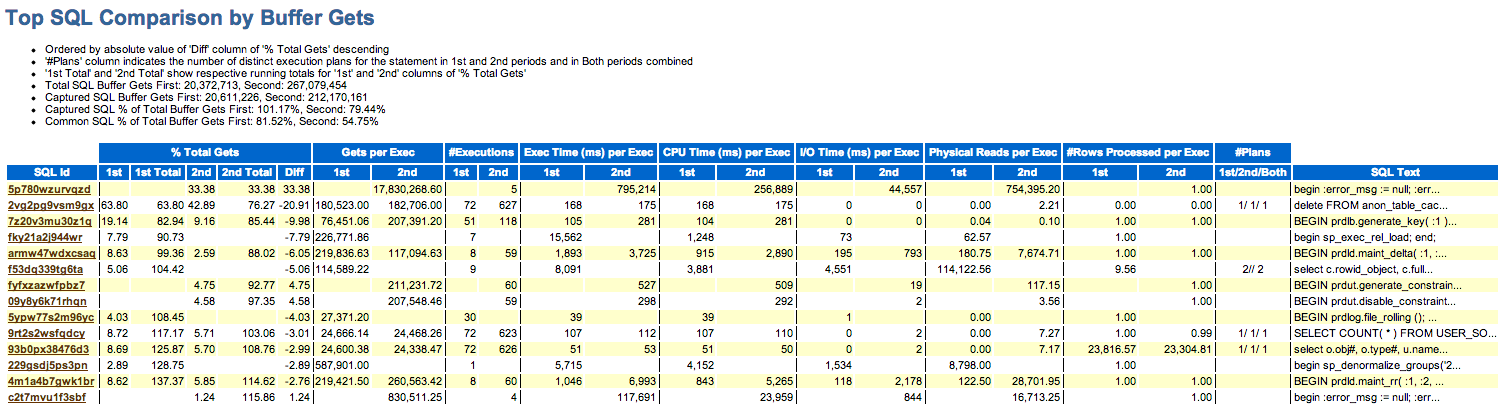
Note that it reads like a combination AWR and diff report; items present in one time window but not in the other are shown, and items present in both time windows have deltas for comparison. SQL Metrics have the same capability, so you can compare executions, time, and other key metrics:
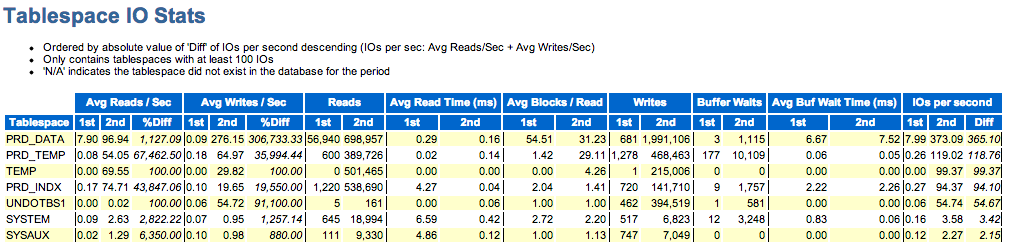
You can also compare I/O metrics:
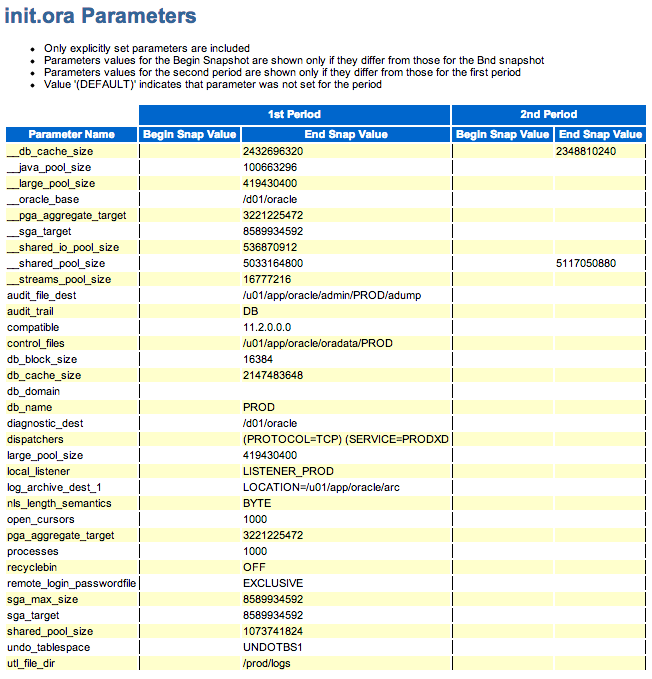
And for the “what changed?” crowd, compare initialization parameters:
You can see an example AWR diff report here. Note that object names have been changed and query text removed to protect the innocent.
If you are not using AWR diff reports, I highly suggest you make your terminal a little wider and give them a shot. For viewing them, I’d definitely recommend HTML or Notepad with word wrapping turned off.
This is really good information. Thank you for sharing.